
Rugby Betting Margins Explained: How Overround Works and Where to Find the Tightest Odds
 Available in US
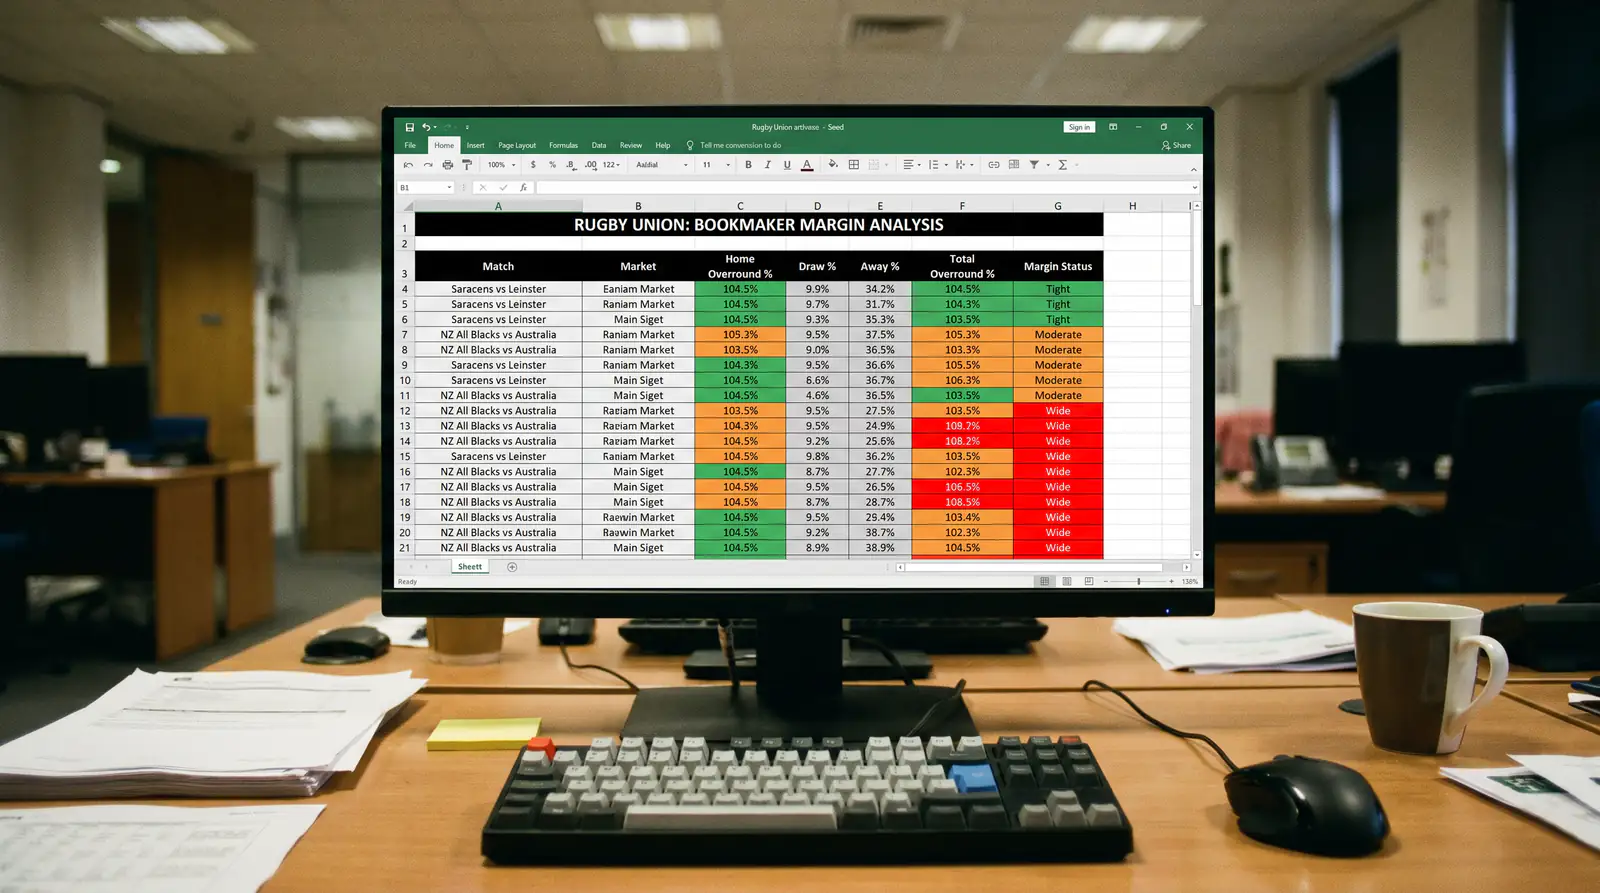
The first time I calculated a bookmaker’s margin on a rugby match, I felt like I’d been shown how a card trick works. The home win was priced at 1.60, the draw at 21.00, the away win at 2.80. I added up the implied probabilities – 62.5% plus 4.8% plus 35.7% – and got 103%. That extra 3% was the bookmaker’s built-in profit, hidden in plain sight across the three outcomes. Every rugby bet you’ve ever placed had a margin embedded in it, and understanding exactly how large that margin is – and where it varies – is the difference between bleeding money slowly and giving yourself a fighting chance.
What the Overround Is and How to Calculate It
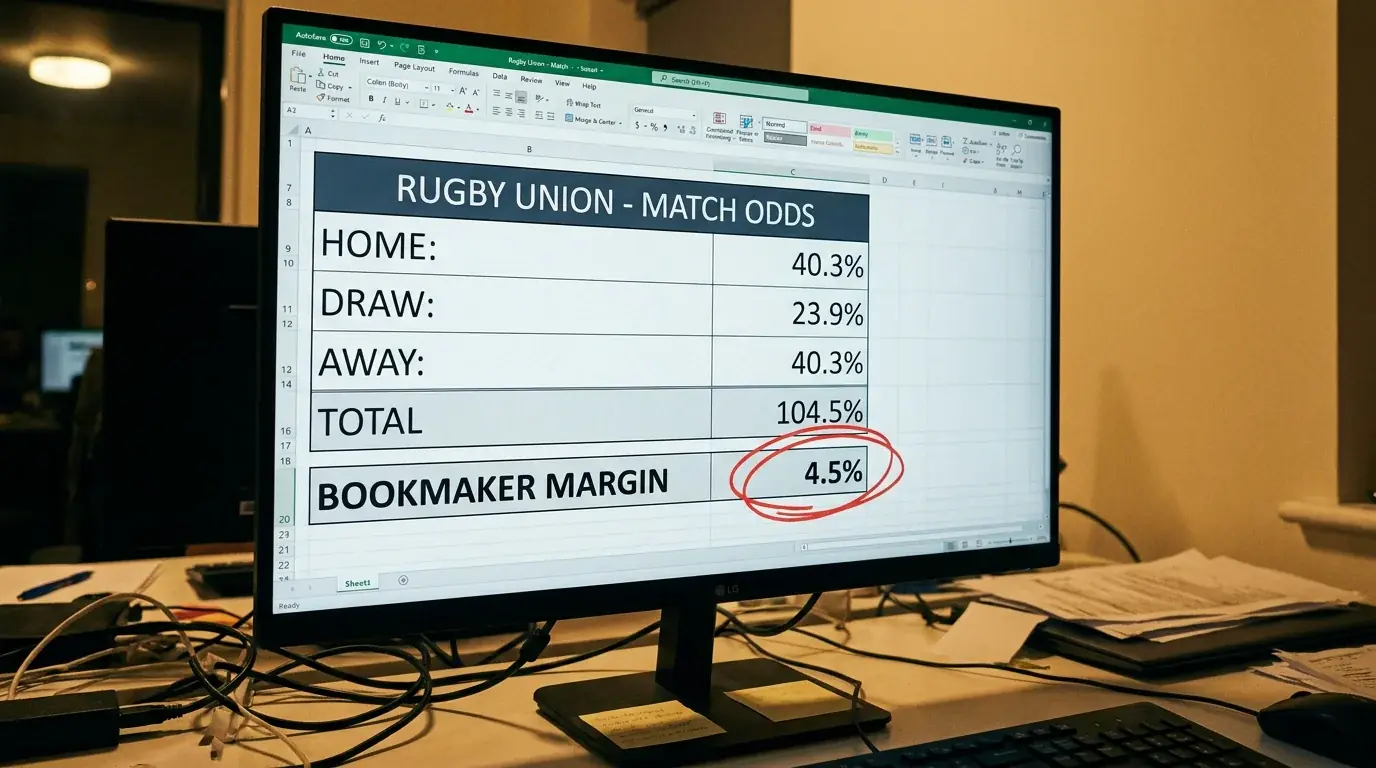
The overround is the total of implied probabilities across all outcomes in a betting market. In a perfectly fair market with no margin, the overround would be exactly 100%. Every percentage point above 100% is profit baked into the odds for the bookmaker. The formula is simple: for each outcome, divide 1 by the decimal odds, sum the results, and express the total as a percentage.
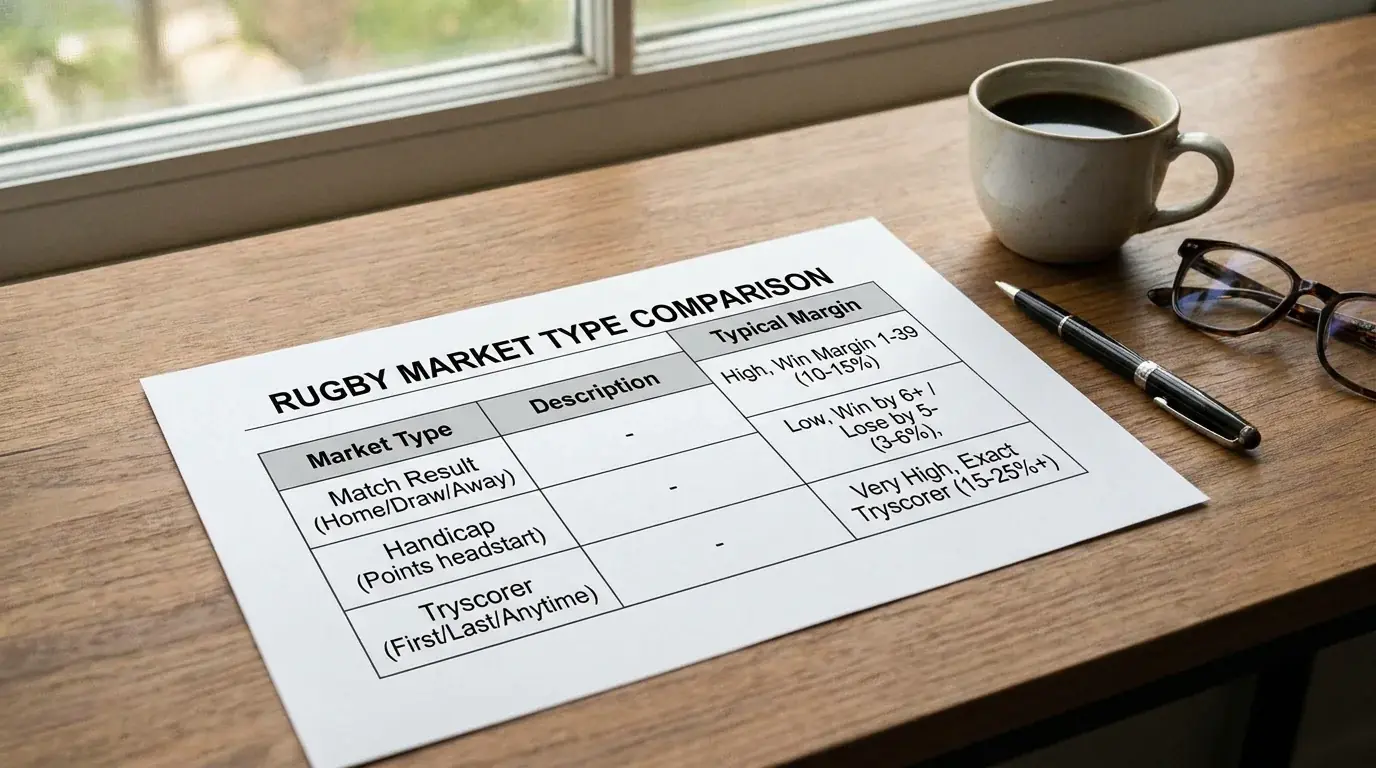
A Six Nations match-result market might carry an overround of 102% to 104% at competitive operators. A Premiership fixture with less public interest might sit at 104% to 107%. A first tryscorer market on the same match could run to 130% or higher, because the bookmaker spreads their margin across 30 or more possible outcomes rather than three. That variation matters enormously: the margin on a tryscorer bet is ten times the margin on a match-result bet, which means you need ten times the edge to break even.

Around 290 million online bets are placed monthly in the UK, and the operators who process those bets compete partly on margin. The tightest-margin operators attract price-sensitive bettors, while wider-margin operators compensate with better promotions or more markets. I track the average overround by competition across four operators every season, and the differences are consistent enough to inform where I place each type of bet.
How Margins Differ Across Rugby Markets and Competitions
During the 2025 autumn internationals, I recorded margins across eight operators on every England fixture. Match-result markets averaged 3.2% overround at the tightest operator and 5.8% at the widest – a gap that translates directly into your returns over a season of betting. On handicap markets for the same fixtures, the range was 4.1% to 7.3%. Total points sat between 4.5% and 8.0%. The pattern is consistent: the more popular the market, the tighter the margin, because higher volume allows the bookmaker to manage risk with less cushion.
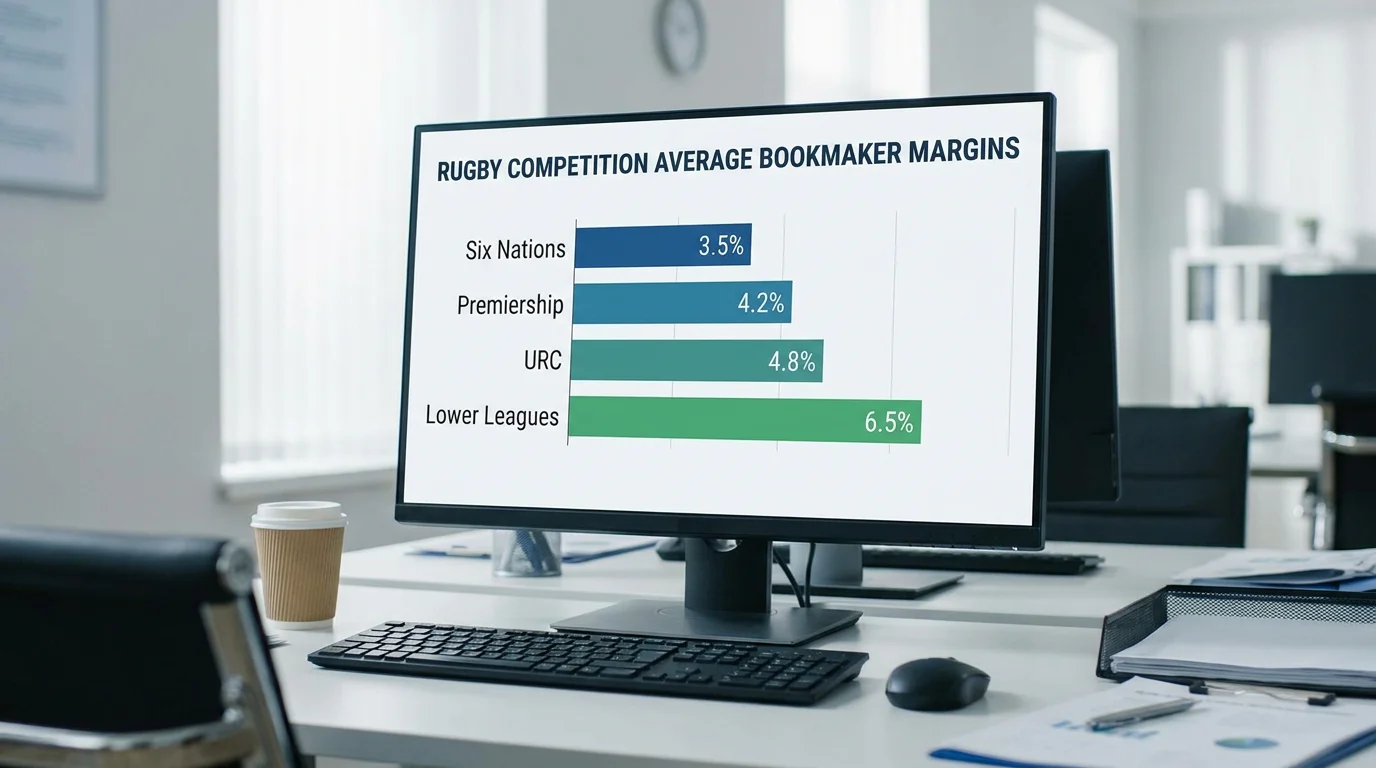
Competition matters too. Six Nations matches attract the most betting volume in the rugby calendar, and the margins are correspondingly tight. The Premiership sits a step behind, with margins roughly 1 to 2 percentage points wider on equivalent markets. Super League is wider again, reflecting lower betting interest among the general public. URC fixtures are the widest-margin domestic rugby product I track, with match-result overrounds occasionally touching 8% at some operators.
Global rugby betting turnover exceeded 600 million euros in 2023, and that figure is concentrated heavily on international fixtures and the top domestic leagues. The further you move from that concentration, the wider the margins become. Betting on a Tier 2 international or a lower-league domestic fixture means accepting margins that can double those on a Six Nations match. I factor this into my staking: if the margin on a market exceeds 6%, I need a proportionally larger edge to justify the bet, and the number of situations where I have that kind of edge on obscure fixtures is small.
Practical Strategies for Reducing the Margin’s Impact
I lost roughly 400 pounds to avoidable margin erosion in my first full year of rugby betting because I used a single bookmaker for everything. The fix was embarrassingly simple: open accounts with multiple operators and compare prices before every bet. The price difference between the best and worst operator on the same outcome is typically 3 to 8% on match-result markets and can reach 15% on tryscorer or player prop markets. Comparing takes two minutes per bet. Over a season of 150 to 200 bets, the cumulative saving from consistently backing at the best available price runs to hundreds of pounds.
Odds comparison tools automate this process, but they have limitations I’ve written about in the comparison tool guide. Coverage gaps on less popular competitions, delayed updates, and the exclusion of some operators from aggregation feeds mean you should cross-check manually on the matches you care most about.

The second strategy is market selection. If your analysis gives you a view on the likely winning margin, you can choose between a match-result bet (tight margin, less precise), a handicap bet (medium margin, more precise), or a correct-score-band bet (wide margin, most precise). I default to the tightest-margin market that captures my view. Backing the favourite to win by 10 or more points through a handicap line at 4% overround is almost always better value than the same view expressed through a winning-margin market at 12% overround.
The third strategy is timing. Margins on popular markets narrow as kick-off approaches, because increased betting volume forces more competitive pricing. Opening odds posted on Monday morning carry wider margins than the same market at 2pm on Saturday. I place the majority of my Six Nations bets within four hours of kick-off for this reason – the margins are tightest, the team news is confirmed, and the price reflects the most current information. The exception is outright tournament markets, where early-season prices carry wider margins but occasionally offer value that disappears once the market matures and public money arrives.
What is a typical margin on rugby match-result betting?
Six Nations match-result markets carry margins of 3 to 5% at competitive operators. Premiership margins run 4 to 6%. Less popular competitions like the URC or lower-tier internationals can reach 7 to 8%. The margin represents the bookmaker’s built-in profit and is calculated by summing the implied probabilities of all outcomes and subtracting 100%.
How do I reduce the impact of bookmaker margins on my rugby betting?
Compare odds across multiple operators before every bet – price differences of 3 to 8% on the same outcome are common. Choose the tightest-margin market type that captures your analytical view. Time your bets closer to kick-off when margins are narrowest due to higher volume. These habits compound over a season to produce meaningful savings.
Created by the ”Rugby Betting Sites” editorial team.