Rugby Odds Comparison Tools: How They Work and Which Ones Cover Union and League
 Available in US
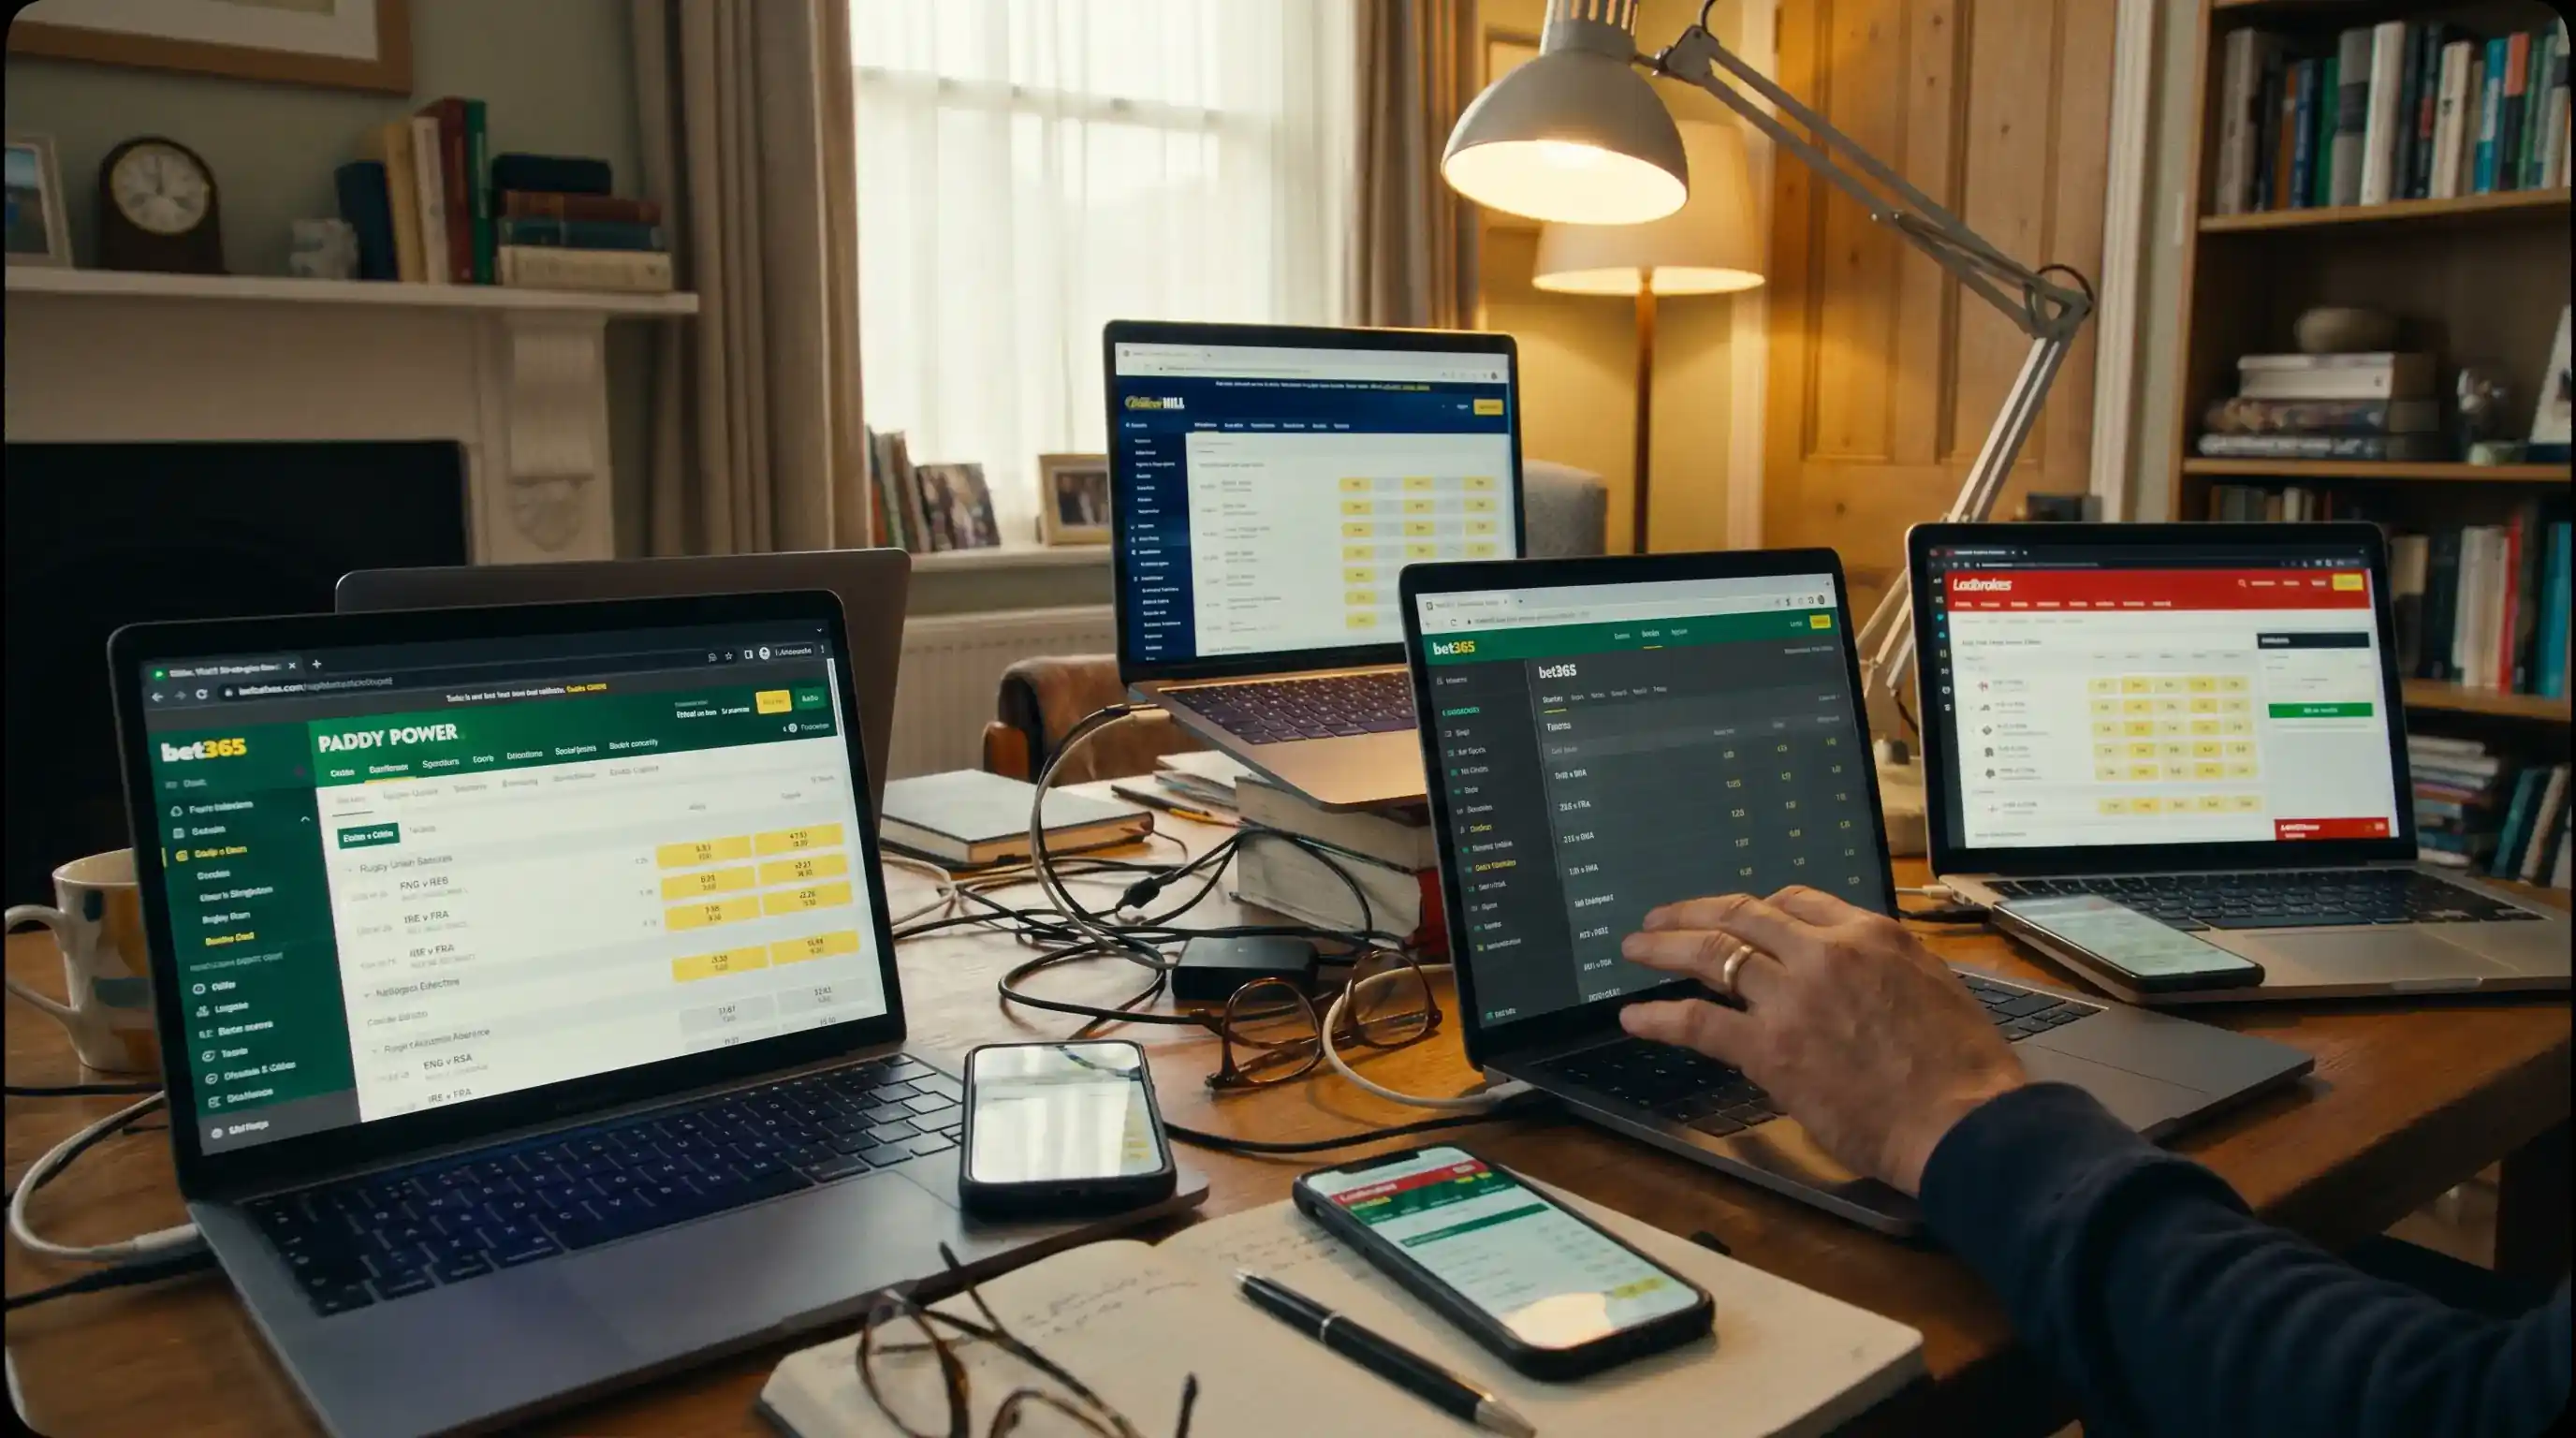
I spent the first four years of my rugby betting career checking odds manually – opening five or six bookmaker tabs in my browser, navigating to the same match on each, and scribbling prices on a notepad before deciding where to place the bet. It worked, but it took 15 to 20 minutes per match, and by the time I’d finished the comparison, the prices had sometimes moved. Discovering odds comparison tools cut that process to under a minute and immediately improved my average price per bet by roughly 3%. That’s not a dramatic edge on any single wager, but compounded across 300 bets a year, it’s the difference between a profitable season and a break-even one.
How Odds Comparison Platforms Aggregate Rugby Prices
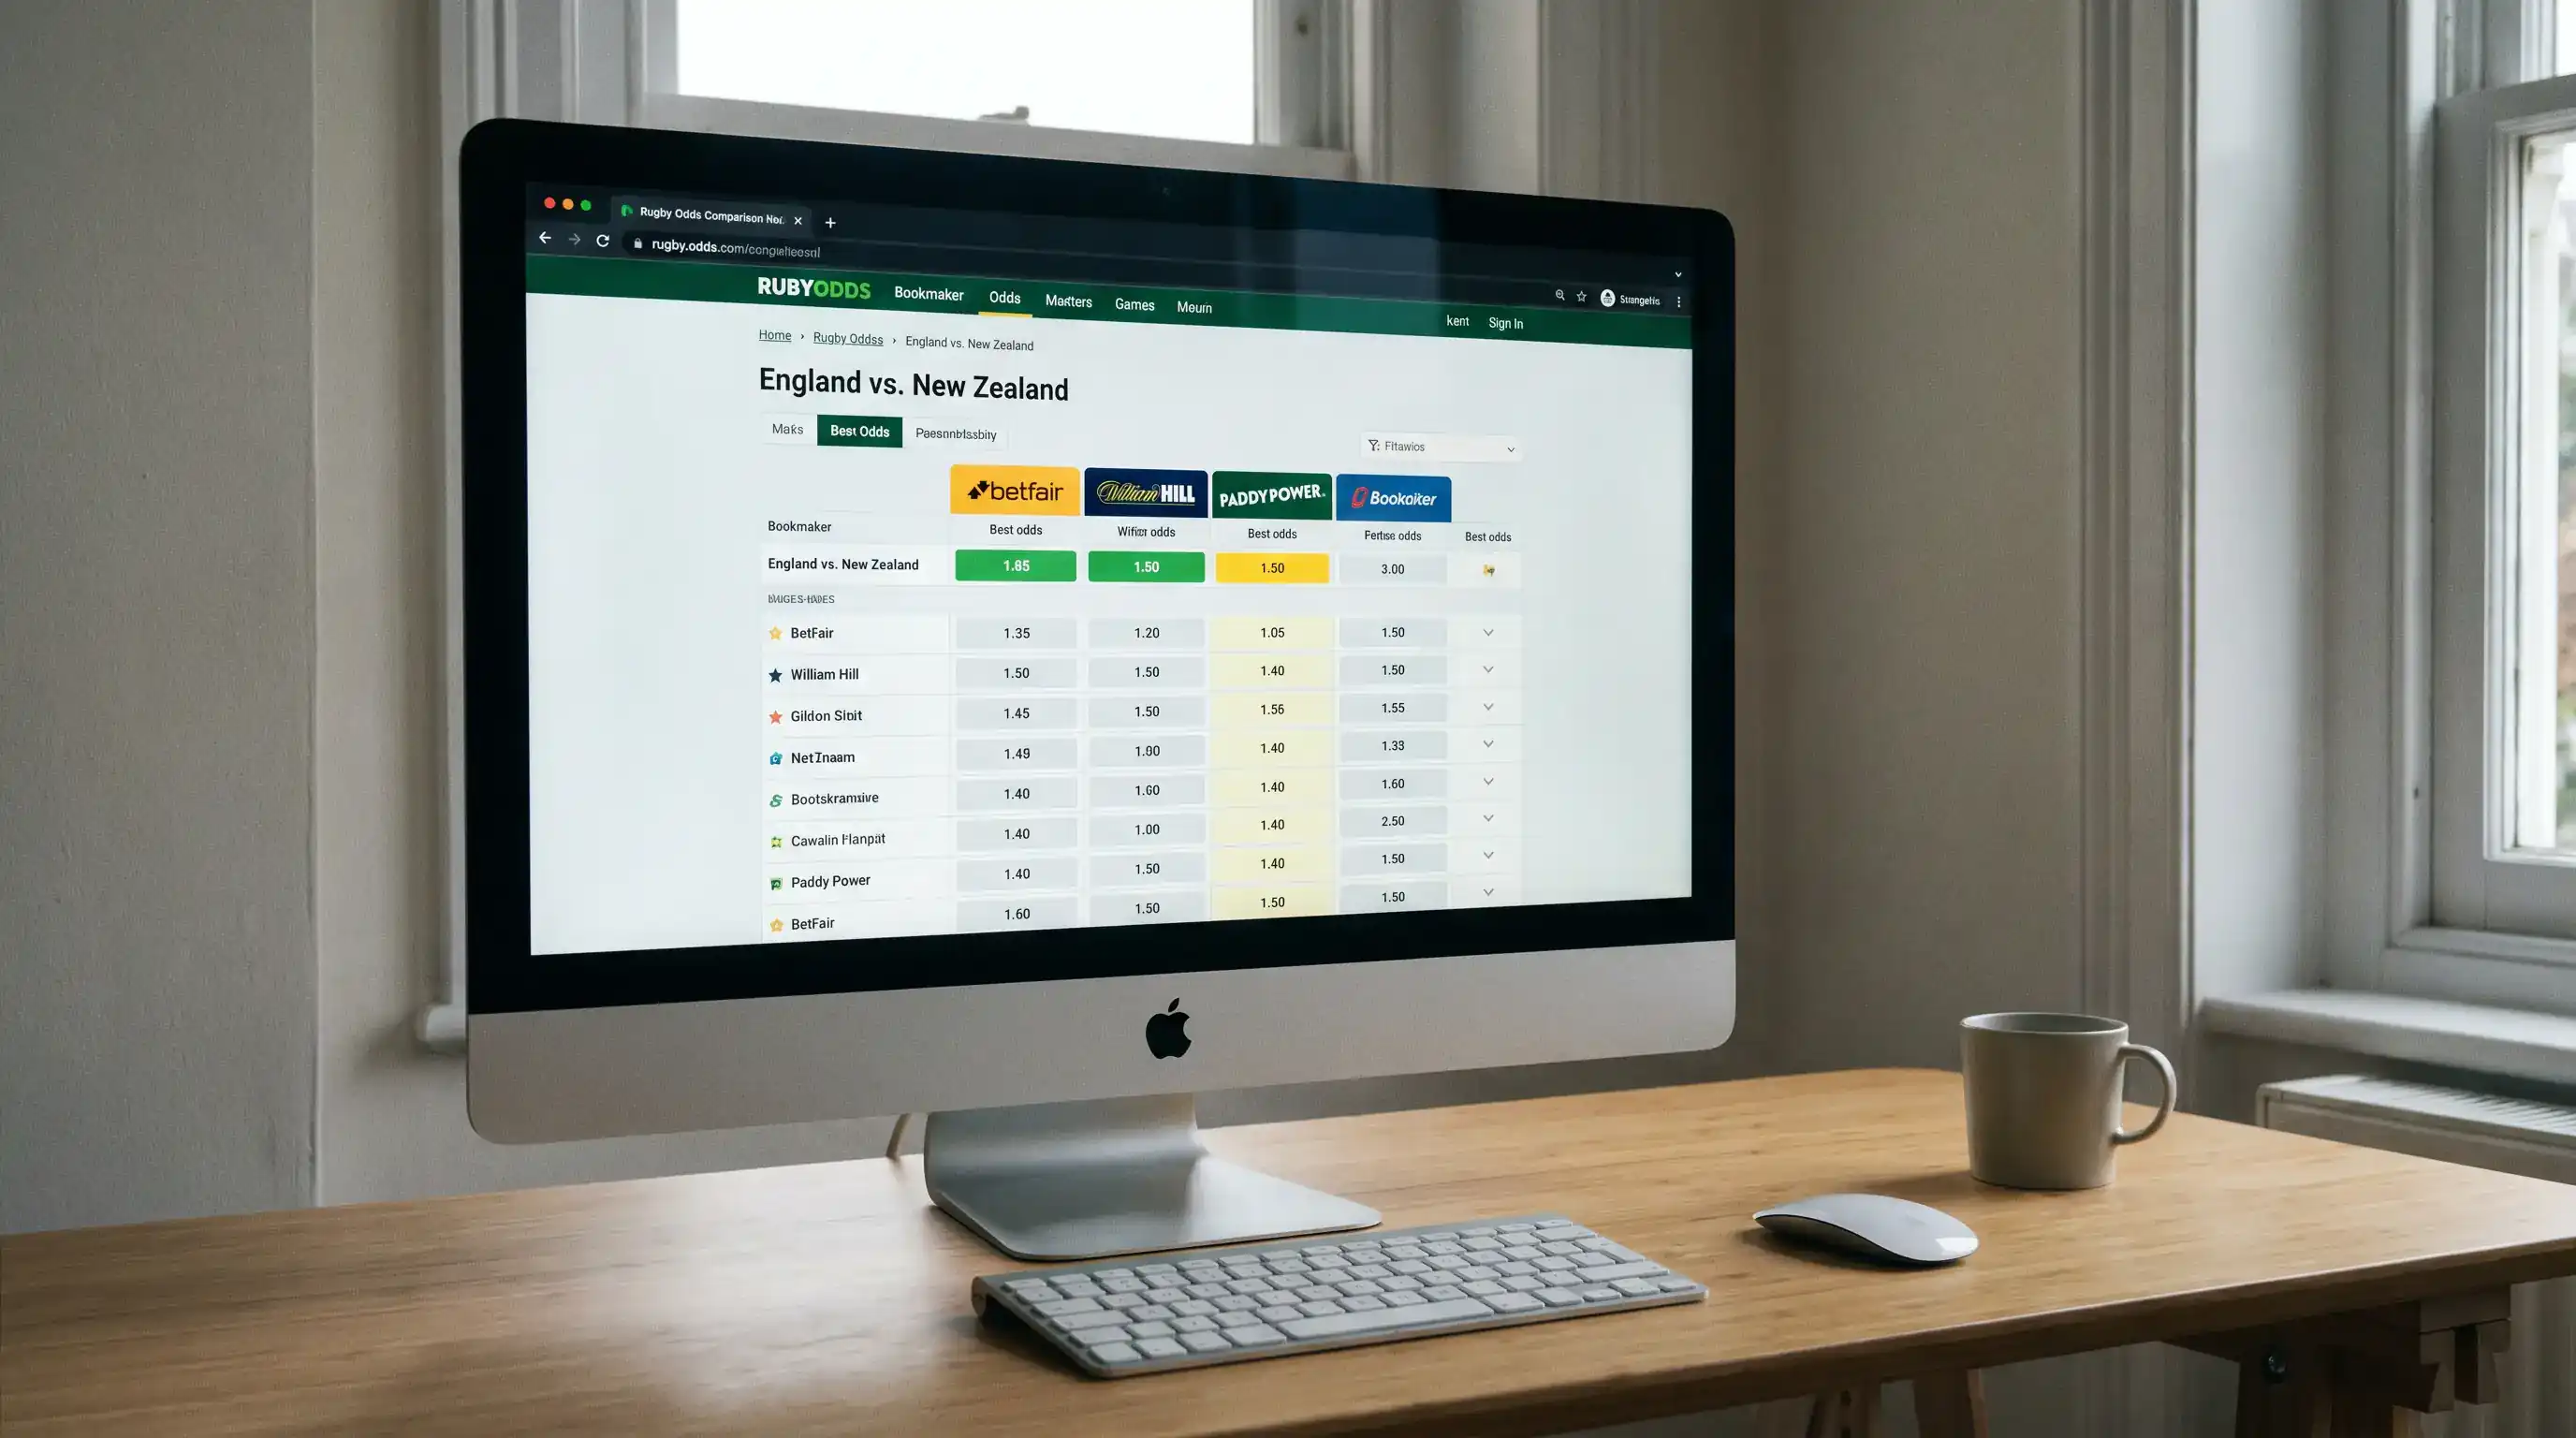
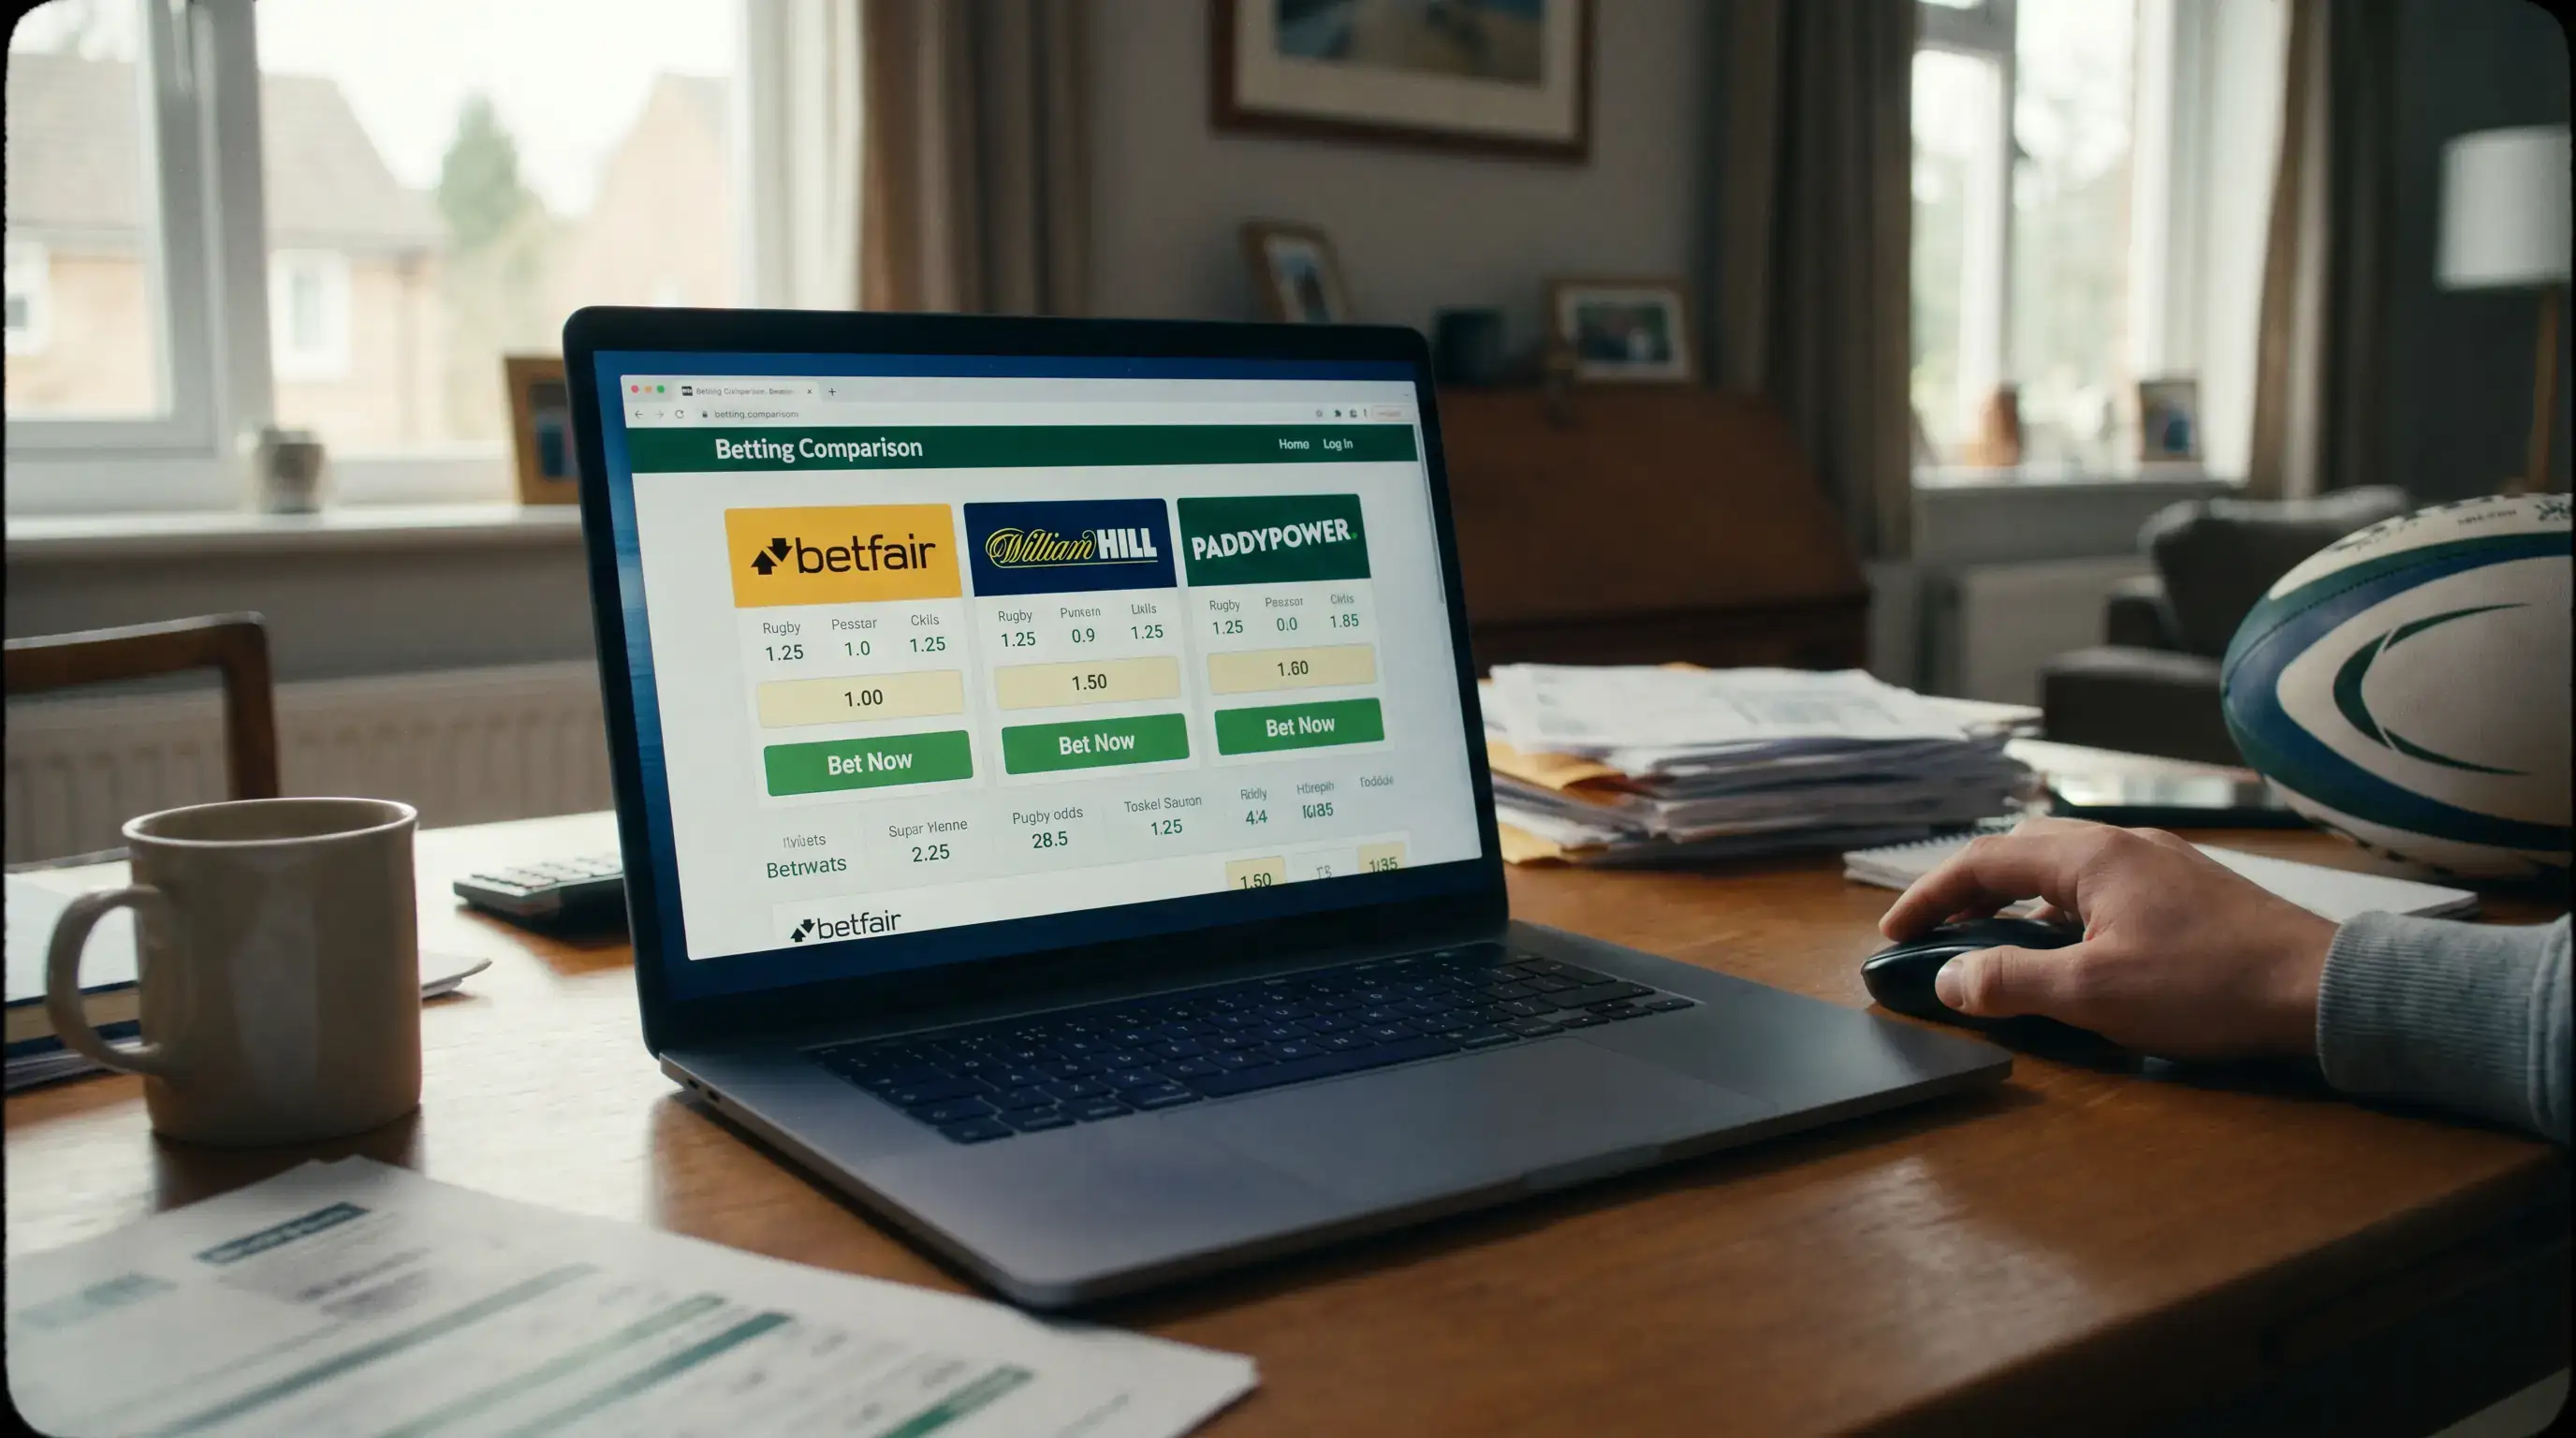
Around 290 million online bets are placed monthly in the UK, and odds comparison tools exist because a meaningful portion of those bettors want to ensure they’re getting the best price. The platforms work by pulling real-time odds data from multiple bookmakers’ APIs or data feeds, then displaying the prices for each selection side by side. You see, at a glance, which operator is offering the highest odds on your chosen outcome.
The data aggregation happens through direct partnerships with bookmakers, who supply their odds feeds in exchange for referral traffic. This creates a commercial relationship worth understanding: comparison sites earn revenue when you click through and place a bet at a partner bookmaker. That revenue model means some operators pay higher commissions for prominent placement, which can influence how results are displayed. The prices themselves are accurate – the legal and reputational risk of displaying incorrect odds is too high – but the visual hierarchy (which bookmaker appears first, which gets highlighted as “best odds”) may reflect commercial arrangements as much as objective ranking.

The aggregation frequency matters too. Premium comparison tools update odds every 30 to 60 seconds, while free-tier tools may refresh every 5 to 10 minutes. For pre-match betting, a 5-minute delay is usually acceptable – rugby odds don’t move as fast as football. For live betting, even a 60-second delay can mean the price you see on the comparison tool no longer exists at the bookmaker by the time you click through.
Comparison Tools with the Best Rugby Market Coverage
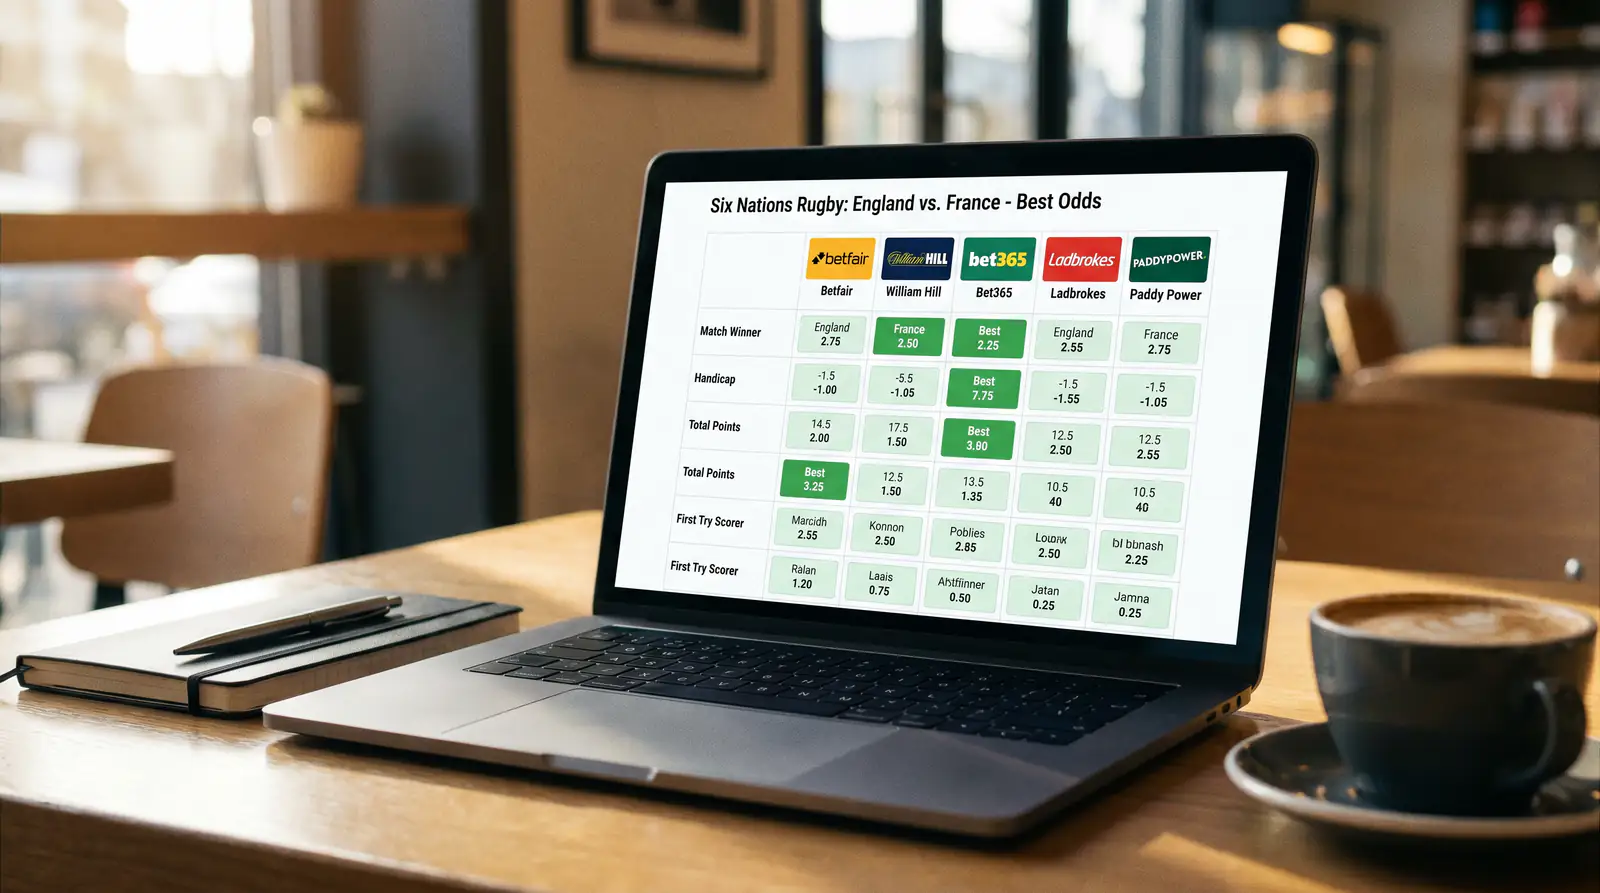
The non-racing segment of UK sports betting generated 5.05 billion pounds in revenue in 2024, and rugby’s share of that market is growing. Despite this, not all comparison tools treat rugby equally. The best platforms for rugby betting comparison share three characteristics: they cover both union and league fixtures, they include major international competitions alongside domestic leagues, and they extend beyond match-result markets to include handicap and total points pricing.
Coverage depth varies significantly. The strongest tools for rugby display odds across match result, handicap, and total points for fixtures in the Premiership, URC, Super League, Six Nations, and European competitions. Weaker tools limit their rugby offering to match result only, or cover union but not league. I maintain a shortlist of three comparison platforms that I’ve found consistently reliable for rugby: one as a primary tool for pre-match checking, one as a secondary for cross-referencing when prices look unusual, and a third that specialises in alternative markets like tryscorer and outright odds.
Mobile experience is another differentiator. Over 70% of UK sports bets are placed from mobile devices, and comparison tools that don’t work smoothly on a phone are tools you won’t use on match day. The platforms I rely on have responsive mobile interfaces that load quickly, display prices clearly, and link through to the bookmaker’s app with the correct match and market pre-selected. That last detail – deep linking to the specific market rather than just the bookmaker’s homepage – saves time and reduces the chance of the odds changing while you navigate.
Limitations and Blind Spots of Comparison Sites
Comparison tools are essential but imperfect, and treating their output as gospel will cost you money. The most significant limitation is market coverage. Most comparison tools cover the main markets – match result, handicap, total points – but very few aggregate odds on player props, tryscorer, bet builder, or specials markets. If your betting strategy focuses on these peripheral markets, you’ll still need to check prices manually across operators.
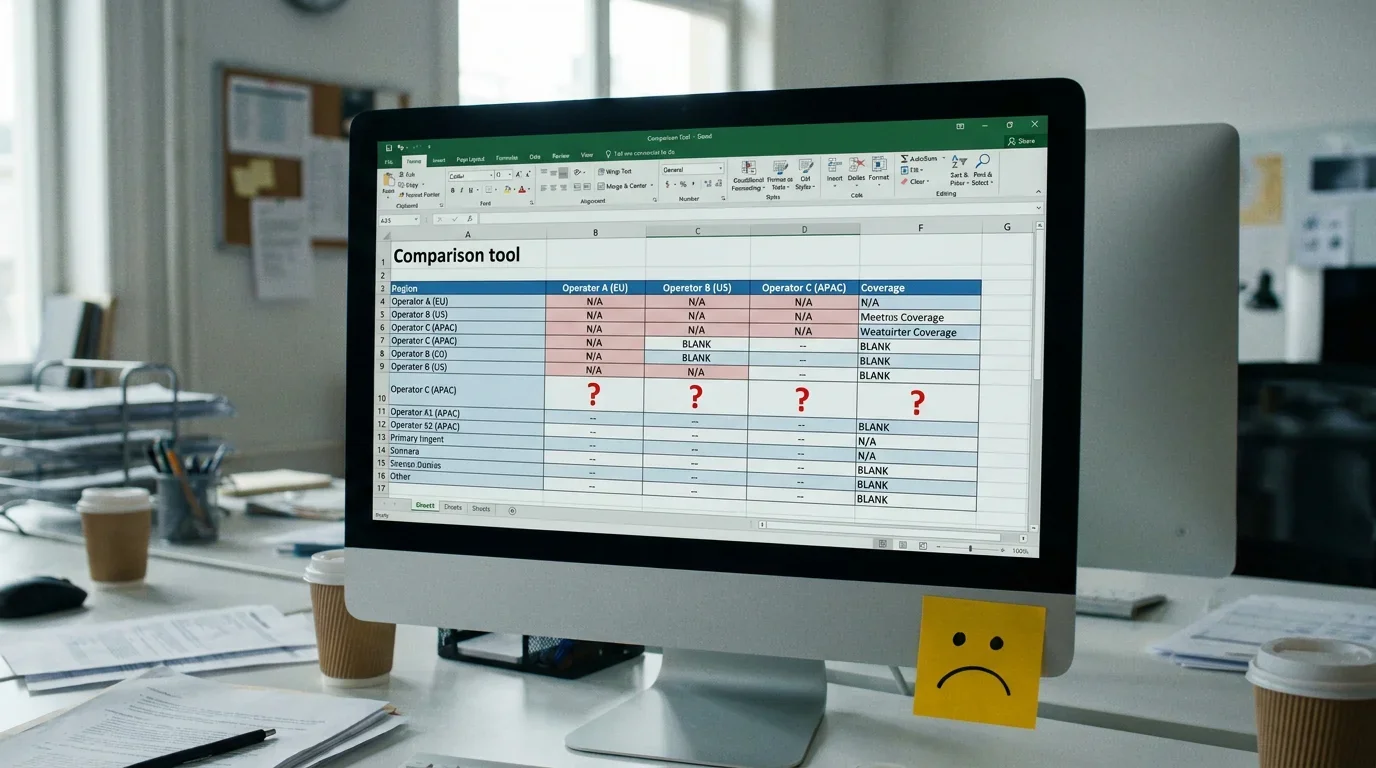
The second limitation is operator coverage. No comparison tool includes every UKGC-licensed bookmaker. Operators who don’t have partnership agreements with a given platform won’t appear in the comparison. I’ve found cases where the “best odds” displayed on a comparison tool were beaten by an operator not included in the tool’s feed. Having accounts at a few operators beyond those listed on your preferred comparison site is a practical hedge against this blind spot.
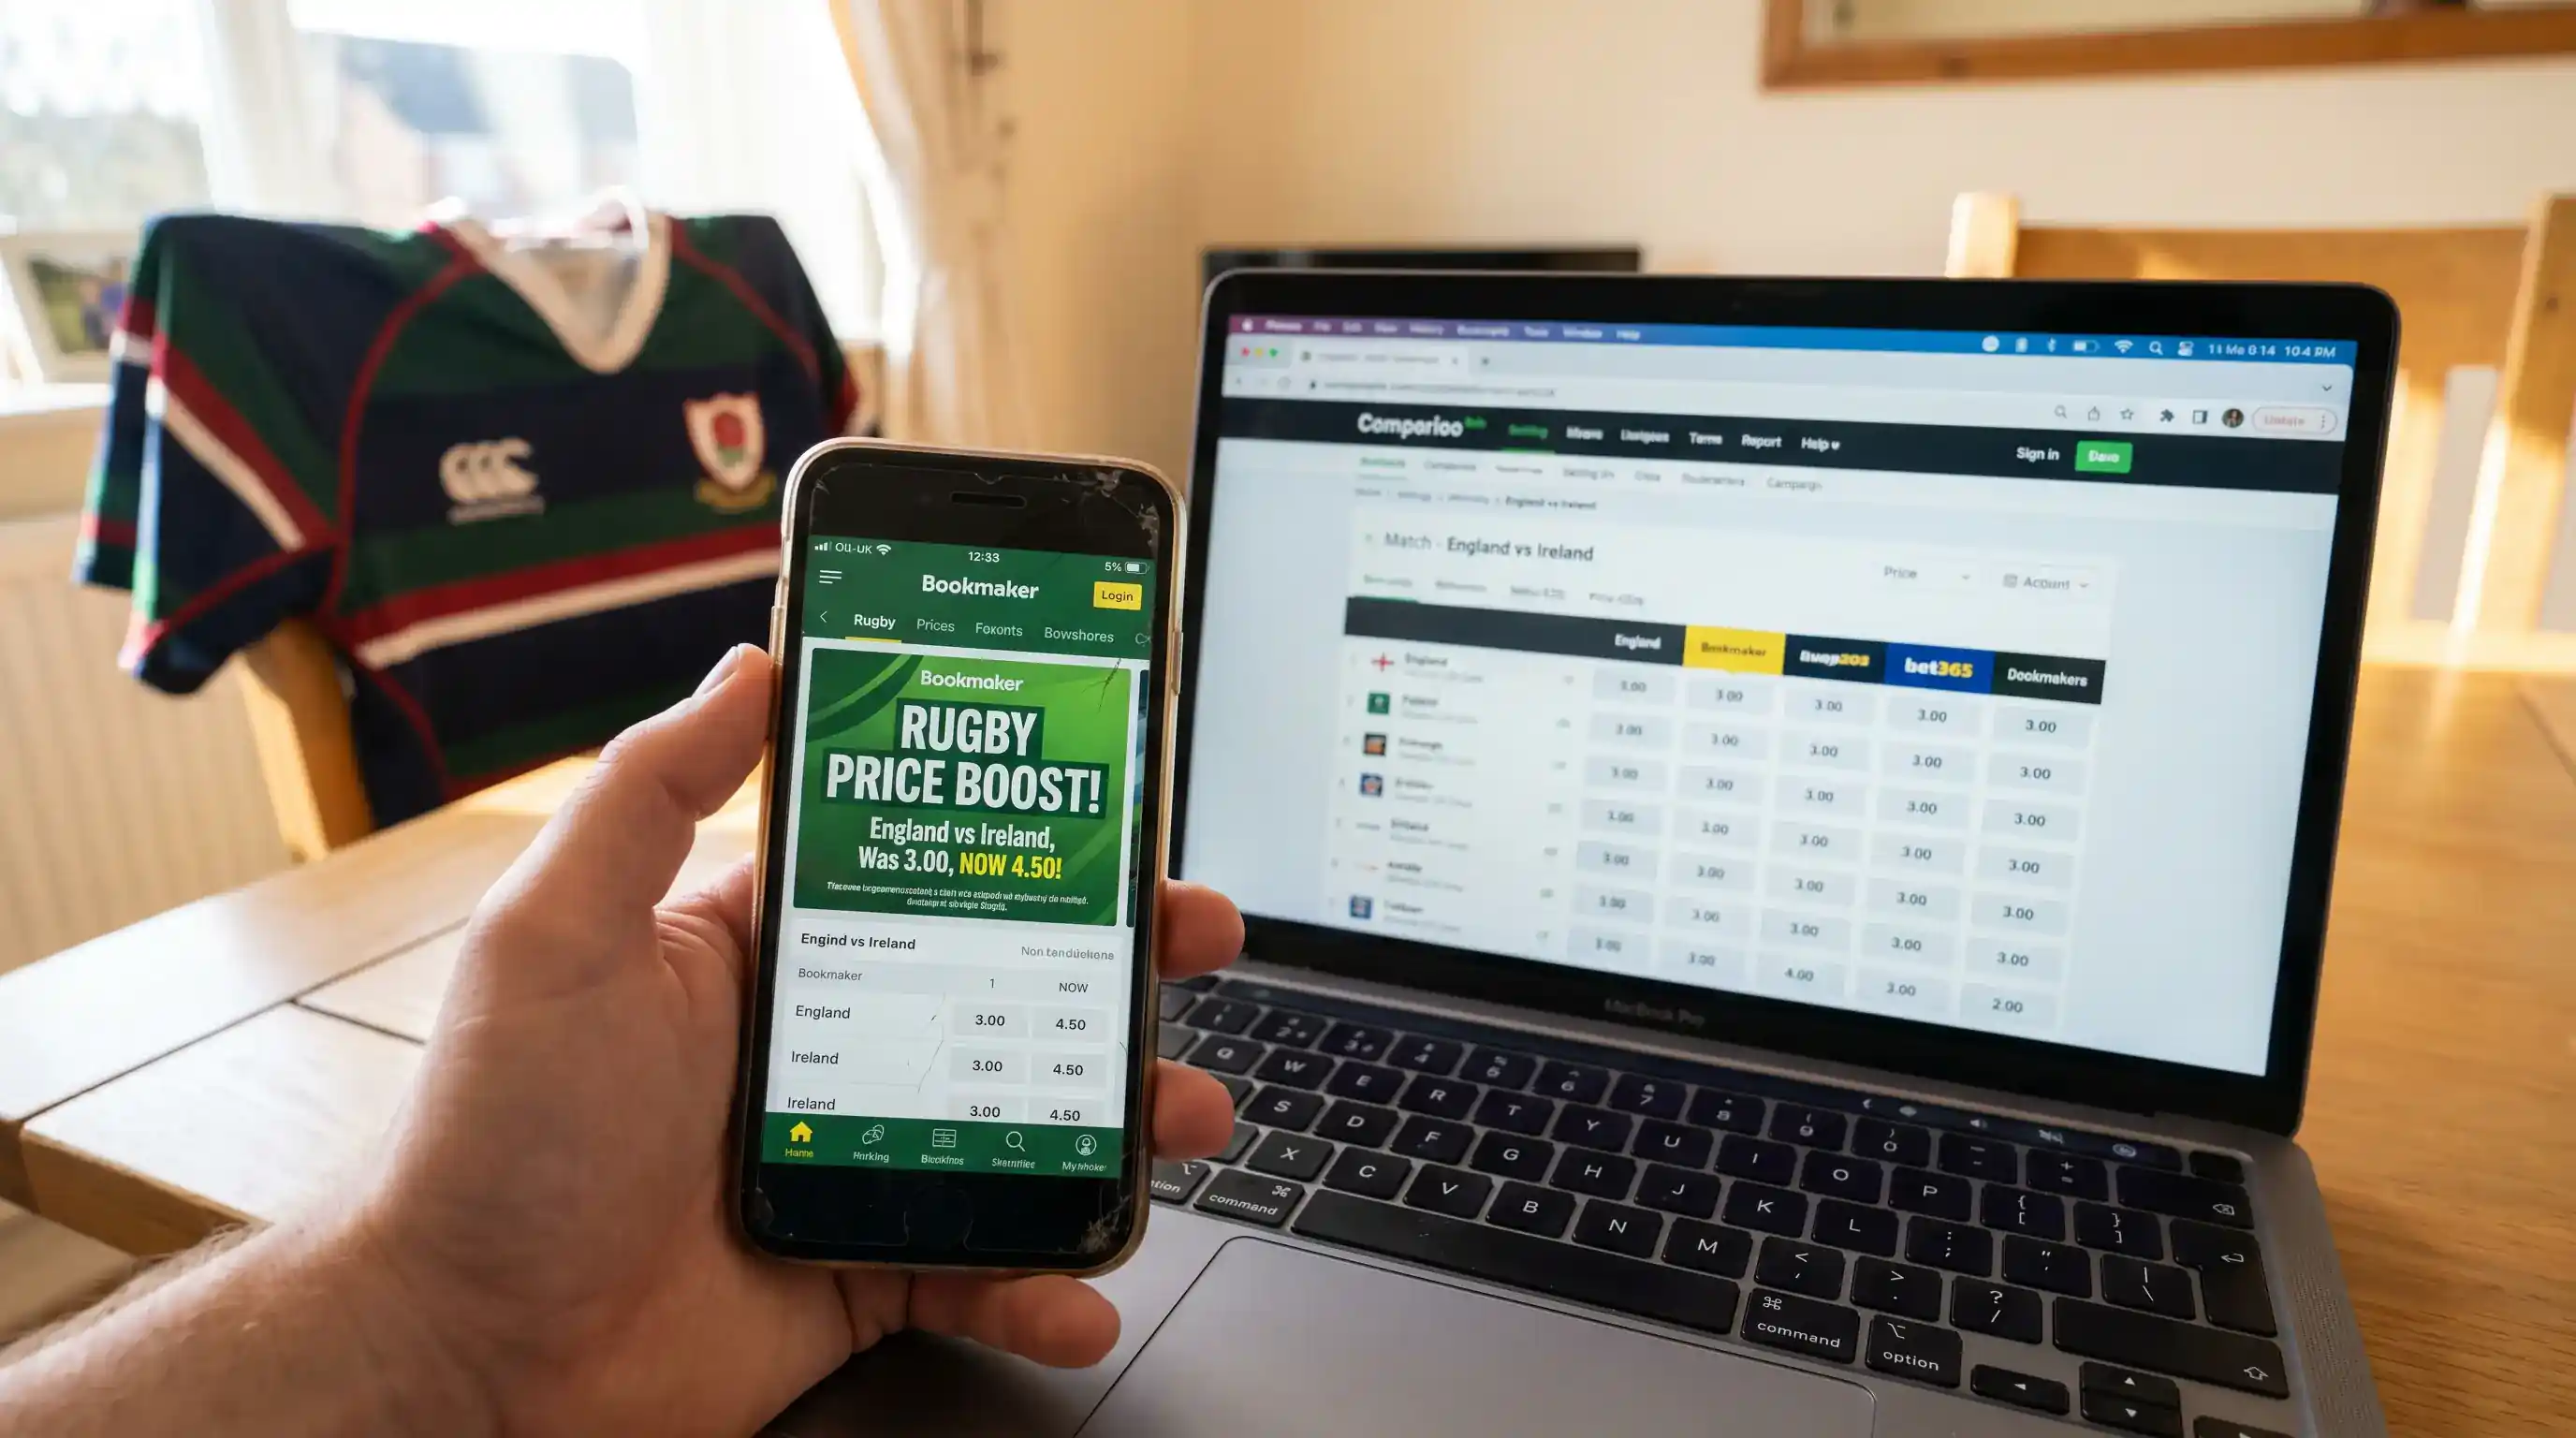
Promotional and enhanced odds are typically excluded from comparison feeds. When a bookmaker offers a price boost on a Six Nations match, that boosted price often doesn’t appear on the comparison tool – you’d only see it by visiting the operator’s site directly. Since price boosts can represent genuine value (I’ve covered how to assess them in the odds fundamentals guide), missing them in the comparison is a meaningful gap.
Live odds comparison is the weakest area for almost every platform. The latency between the bookmaker’s actual live price and what the comparison tool displays makes real-time comparison unreliable for in-play betting. I use comparison tools exclusively for pre-match preparation and switch to direct-to-bookmaker navigation for any live betting activity. Treating comparison tools as a pre-match preparation resource rather than a real-time trading terminal is the right way to integrate them into your workflow.
One final blind spot worth flagging: comparison tools rarely account for exchange prices. If you use a betting exchange alongside traditional bookmakers, you’ll need to check exchange odds separately and factor in the commission before comparing like-for-like. A comparison tool showing the best traditional bookmaker odds at 2.10 might be beaten by an exchange back price of 2.20 after 5% commission, netting you an effective 2.09 – worse in that case, but often better on less popular markets where the bookmaker margins are wider.
Are rugby odds comparison tools free to use?
The major comparison platforms are free for users. They generate revenue through affiliate commissions when you click through to a bookmaker and place a bet. The prices displayed are accurate, though the visual prominence of certain operators may reflect commercial partnerships rather than purely objective ranking.
Do comparison tools include in-play rugby odds?
Some platforms display live odds, but the latency between the bookmaker’s actual price and the comparison tool’s display makes real-time accuracy unreliable. For pre-match betting, comparison tools are effective and reliable. For in-play betting, navigating directly to the bookmaker’s site or app gives you access to the most current prices.
Published by the Rugby Betting Sites team.