Rugby Union vs League Betting: Rule Differences, Scoring Systems and Market Implications
 Available in US

I backed the wrong code once – placed a handicap bet on a Super League match using a union-based total points model and lost badly. The model assumed an average match total of 42 points. The actual total was 58. League’s faster play-the-ball, the six-tackle rule, and the absence of contested scrums produce scoring patterns that look nothing like union, and my model was useless because I’d treated the two codes as variations of the same sport. They aren’t. For betting purposes, union and league are separate analytical disciplines with distinct market structures, different pricing dynamics, and almost no transferable assumptions.
Scoring Rules That Shape the Betting Landscape
A union try is worth 5 points with a 2-point conversion; a league try is worth 4 points with a 2-point conversion. That single-point difference in try value ripples through every market. Union matches average higher points per try but fewer tries per match, because the contested breakdown and set piece slow the ball down. League matches produce more tries but fewer points per try, because the structured tackle count creates predictable phases of attack that generate crossing opportunities more frequently.
Penalty goals illustrate the divergence further. In union, a penalty kick at goal is worth 3 points and is a common tactical choice – some matches see 15 or more points scored exclusively from penalties. In league, the penalty goal is worth 2 points and is elected far less frequently because teams prefer to use the penalty advantage to restart attacking sets. This means union total points lines are more sensitive to discipline and referee tendencies, while league totals are driven more directly by try-scoring patterns.
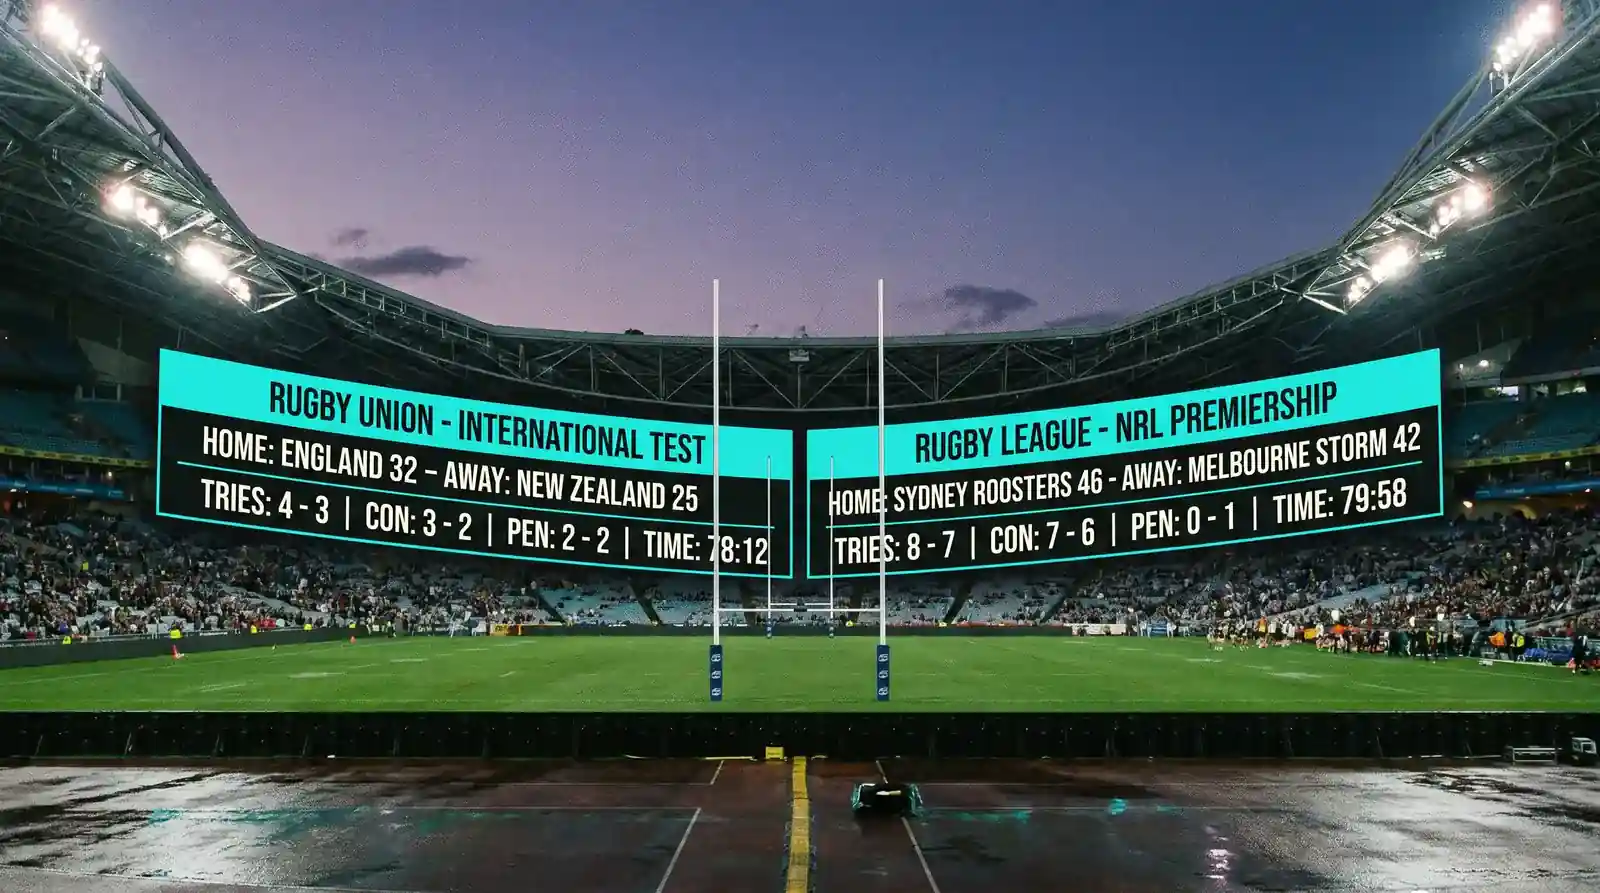
The drop goal is worth 3 points in union and 1 point in league, making it a strategically significant weapon in union (especially in tight knockout matches) and a marginal factor in league. If you’re building a model for total points or handicap markets, the weighting of drop-goal probability needs to be radically different between the two codes. Premiership attendance reached 1,428,276 across the 2023/24 season, and those spectators watched a game where a drop goal can swing a result by 10% in probability terms. In league, the same event barely registers on the match odds.

Market Depth and Pricing Differences
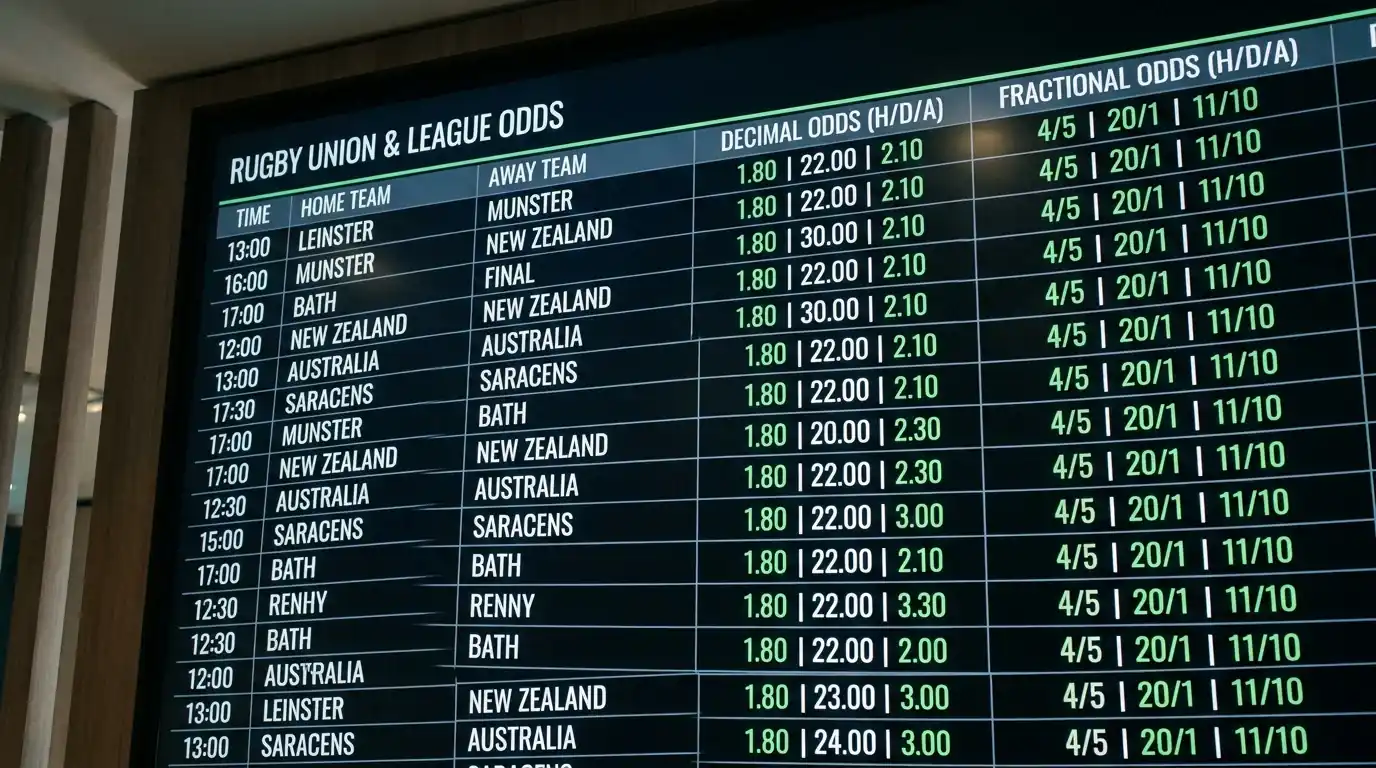
Rugby union attracts deeper markets than league at every level. A Six Nations match generates 80 to 100 betting markets at the best operators. The equivalent event in league – a Super League Grand Final or a State of Origin – produces 40 to 60 markets. Regular-season league fixtures drop further, to 15 or 20 markets at most operators, compared to 30 to 50 for a standard Premiership fixture.
That depth difference affects pricing. Deeper markets mean tighter margins – the bookmaker can spread their overround across more outcomes and manage risk through greater volume. Union match-result margins at competitive operators sit between 3% and 5% for top-level fixtures. League match-result margins run 4% to 7% on Super League and significantly wider on Challenge Cup or lower-division matches.

The in-play product differs too. Over 30% of UK sports bets are now placed during the match, and the live data feeds that support in-play pricing are more granular for union than for league. Union live data typically includes territory, possession, phase count, scrum and lineout statistics – all of which feed the live pricing algorithm. League live data is thinner, focused on tackle counts, metres gained, and set completion rates. The richer union data set means more frequent odds updates and tighter in-play margins.

I maintain separate accounts for union and league betting, and my staking framework treats them independently. The edge thresholds, margin tolerances, and market selection criteria differ because the two codes produce structurally different pricing environments.
Adapting Your Analysis Between Codes
The six-tackle rule in league is the single biggest analytical differentiator. In union, possession is open-ended – a team can build through 15, 20, or 30 phases before a turnover, penalty, or score. In league, each set has a maximum of six tackles before possession is conceded. That structured possession creates predictable attacking patterns and makes field position – specifically, where a team starts their set – the dominant variable for try-scoring probability.
For league handicap betting, set completion rate is the metric I weight most heavily. A team completing 80% or more of their sets consistently generates more attacking opportunities in dangerous field position than a team completing 70%. The difference in set completion translates directly into scoring differential, and it’s a more reliable predictor of handicap outcomes than headline stats like metres carried or offloads. Union has no equivalent metric because possession structure is organic rather than mechanised.

Weather affects the two codes differently. Rain suppresses scoring in both, but the mechanism differs. In union, wet conditions degrade lineout accuracy and handling in the wider channels, pushing teams toward a kicking game and penalty accumulation. In league, rain primarily reduces offloading and catch-and-pass accuracy in the middle third, which limits the attacking width but doesn’t reduce the structured tackle-count progression. A heavy rain forecast should push your union total-points assessment lower by 8 to 12 points, but your league assessment only by 4 to 6 points.
If you’re transitioning from one code to the other, the most common mistake is importing your union intuition into league or vice versa. The sports share a name and a ball shape, but the total points dynamics, the tactical incentives, and the market structures are different enough that each code deserves its own analytical framework built from scratch. I spent six months building a league model before I was comfortable placing serious stakes, and the time investment paid for itself within the first season.
Is rugby union or rugby league better for betting?
Neither is inherently better – they offer different opportunities. Union provides deeper markets, tighter margins, and richer in-play data, making it better suited to systematic comparison-based approaches. League produces more predictable scoring patterns and structured possession, which can benefit bettors who specialise in total points and handicap analysis. Most serious rugby bettors develop separate models for each code.
Can I use the same betting model for union and league?
No. The scoring systems, possession structures, and tactical frameworks differ fundamentally. A union total-points model built around contested breakdowns and penalty accumulation will fail on league matches, where the six-tackle rule, set completion rates, and structured field position drive the scoring. Each code requires its own model with code-specific inputs.
Prepared by the Rugby Betting Sites editorial staff.